Daily Leverage Certificates
DLC Hotline: (65) 6226 2828
Market Commentary (Hong Kong)
For the week ending 08 March 2024
Spot gold made a new all-time-high this week, touching USD 2195.15 per ounce. Fed Chair Powell testified in Congress that rate-cuts ‘can and will begin’ this year.
● German automotive component supplier Eissmann Automotive filed for bankruptcy
● Data from Counterpoint Research shows that Apple’s iPhone sales in China fell 24% in the first six weeks of this year. China is the world’s largest smartphone market.
● US-based Semiconductor Industry Association reported that China’s semicon sales grew 26.6% y-o-y in January this year, faster than the US and the rest of the world.
● Country Garden creditors have hired consultants to handle debt restructuring talks. A petition to wind up the company will be heard in a Hong Kong court in May this year.
● The US House Commerce Committee voted 50-0 to force ByteDance to sell TikTok or be banned from the US. Concurrently, the Senate’s Home Security Committee approved a bill to forbid contracts with China’s biotech companies.
● China’s trade surplus for the first two months of the year grew 20.5% y-o-y. Exports grew 7.1% over the same period. Both numbers beat expectations.
Hang Seng Index closed this week at 16353, down 236 points or 1.42%. Price action over these two weeks suggest potential resistance from the 100-Day SMA (red) on top and potential support from the 50-Day SMA (purple) from below. 10- and 20- are still rising which suggests that upward momentum is intact. However the larger trend is still associated with further losses and there is no prominent reversal chart pattern.

HSI weekly chart from 02 January 2023 to 08 March 2024 (Source: DLC.socgen.com)
Hang Seng Tech closed the week at 3386, down 103 points or 2.94%. Overhead 3500 appears to be potential resistance, below support could come from a combination of the 20- (green) and 50-Day SMA (purple). 10- and 20-Day suggests short term uptrend is intact but the larger setup is still associated with further losses. No prominent reversal chart pattern can be observed.
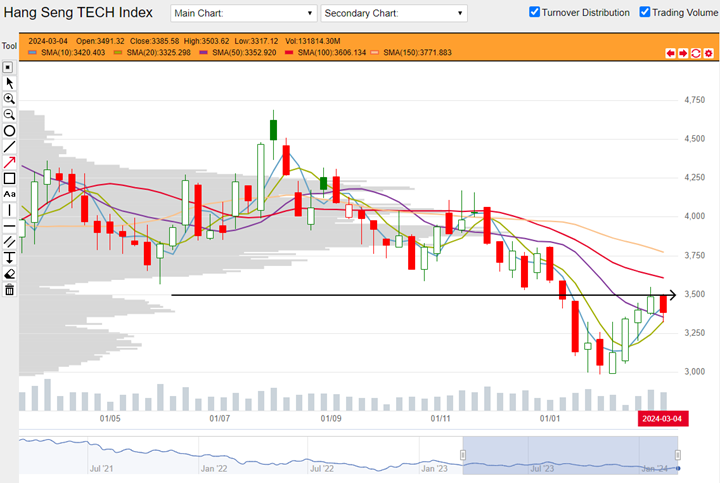
HSTech weekly chart from 02 January 2023 to 08 March 2024 (Source: DLC.socgen.com)
Nasdaq printed a new all-time-high but closed in the red. Dow closed in the red at a two-week low. Importantly the Dow closed below its 10- and 20-Day SMAs although there is no dead cross between this pair of indicators yet. This could be the first sign of weakness. However Nasdaq and Dow both still display setups that are associated with further gains.
The next FOMC meeting is scheduled on 20 March 2024.
Fed funds futures on rate hike probability by next Fed meeting as at this week’s close:
● 97.0% probability of no change |3.0% probability of 25 basis points cut
Fed funds futures on rate hike probability by next Fed meeting at last week’s close:
● 96.0% probability of no change |4.0% probability of 25 basis points cut
Probabilities on the CME Fedwatch Tool indicate no more rate hikes for this year but also indicate possibility for rates to stay at current level until January next year. Probabilities predict a cumulative 175 basis points cut for the whole of 2024 and up to 200 basis points between now till March 2025.
Shanghai closed the week at 3046, up 19 points or 0.63%. Shenzhen closed at 9369, up 102 points or 1.1%. Technically, moving average indicators point to both indices rising against a well-established downtrend. No prominent reversal pattern is visible. Shanghai’s four-week rally so far closed above all its moving average indicators although golden’ crosses for the longer averages have not followed. Based on previous swing lows and swing highs in the second half of 2023 suggests that both indices could be close to some potential resistance.
Other news:
● AIA and Kuaishou bought back shares.
● CNOOC printed a new 52-week high.
● BYD announced that it will repurchase up to CNY400M of shares at a price not exceeding CNY270.
● South Korean think tank SNE said that BYD retained the top sales spot for EVs in January. Tesla placed second and Geely third.
● JD.com’s logistic unit Dada Nexus admitted to financial fraud, inflated revenue figures.
Technical observations
Netease 9999.hk bearish engulfing candle at triple-resistance.
Note chart features:
1. The region $173-176 could be a strong potential resistance. Based on price action, we can see that this zone was a turning point for three swing highs in the past from mid-2022 till the present. If we count the current bearish engulfing pattern as a potential swing high, this could be the fourth one. With the engulfing candle, Netease closed at its three-week low and is now below its 10- and 20-Day SMAs. Based on the low of the week, the 100-Day SMA (red) could offer some support.
2. Notably, the current pattern appears to be a rising wedge as defined by the two trend lines drawn in this chart. Rising trend lines could have bearish outcomes. Also note that based on the current price level, the 50-Day SMA appears to be already lower than when price was at the previous top. This could be an indication of a not so obvious decline.

Netease 9999.hk weekly chart from 03 January 2022 to 08 March 2024. (Source: DLC.socgen.com)
Underlying Index/Stock |
Underlying Chg (%)1 |
Long DLC (Bid Change%2) |
Short DLC (Bid Change%2) |
|---|---|---|---|
| Hang Seng Index (HSI) | -0.85% | CVMW (-2.32%) | CZRW (+5.04%) |
| Hang Seng TECH Index (HSTECH) | -1.39% | UQTW (-9.12%) | CWMW (+8.78%) |
| NetEase (9999.HK) | -0.98% | EHPW (-3.76%) | 52PW (+5.30%) |
Brought to you by SG DLC Team
This advertisement has not been reviewed by the Monetary Authority of Singapore. This advertisement is distributed by Société Générale, Singapore Branch. This advertisement does not form part of any offer or invitation to buy or sell any daily leverage certificates (the “DLCs”), and nothing herein should be considered as financial advice or recommendation. The price may rise and fall in value rapidly and holders may lose all of their investment. Any past performance is not indicative of future performance. Investments in DLCs carry significant risks, please see dlc.socgen.com for further information and relevant risks. The DLCs are for specified investment products (SIP) qualified investors only.
Full Disclaimer - here